Decay of learning
I usually find myself becoming quite enthusiastic about something quickly, then looking up tutorials, starting them, and stopping it after a while. Just to give an example, I have much more unfinished coursera courses than finished ones. I guess this behaviour is not characterisitc only for me. Nevertheless, there are some tutorials one “needs” to finish, ones what you actually plan to use on a daily basis. Yesterday I went through Dan Becker’s machine learning tutorial on kaggle. Well, I have an interesting relationship with machine learning and sklearn… I am fiddling around with it almost a year ago now, I did parts of Andrew Ng’s coursera course to help me understand the underlying theory, but then I started using scikit-learn on my own. I think I may haved scrolled through their own tutorial, but it doesn’t require much tutorial to use scikit-learn when you already have an understanding of the implemented methods… Then I got this mail from kaggle that they gonna have some advanced ML course soon, and in order to take it, one should know before hand what is included in the basic course. So well, I figured, maybe it is worth checking what is in the basic course:) Not much new, but still I got couple of more ideas on validating my own models.
Nevertheless, after a while I started to read the number of views on each chapter, and I observed that there is a real decay there. Which was kind of surprising, since this is an extremely short tutorial, literally just few hours. However, the trend nicely coincides with my tendency of not finishing courses as well…:) But of course, kaggle is a platform for machine learning practioners, so maybe many people just opened up the course in hope of learning something new, but then they realized this is really a 101 tutorial, way undert their knowledge, so they quickly left it.
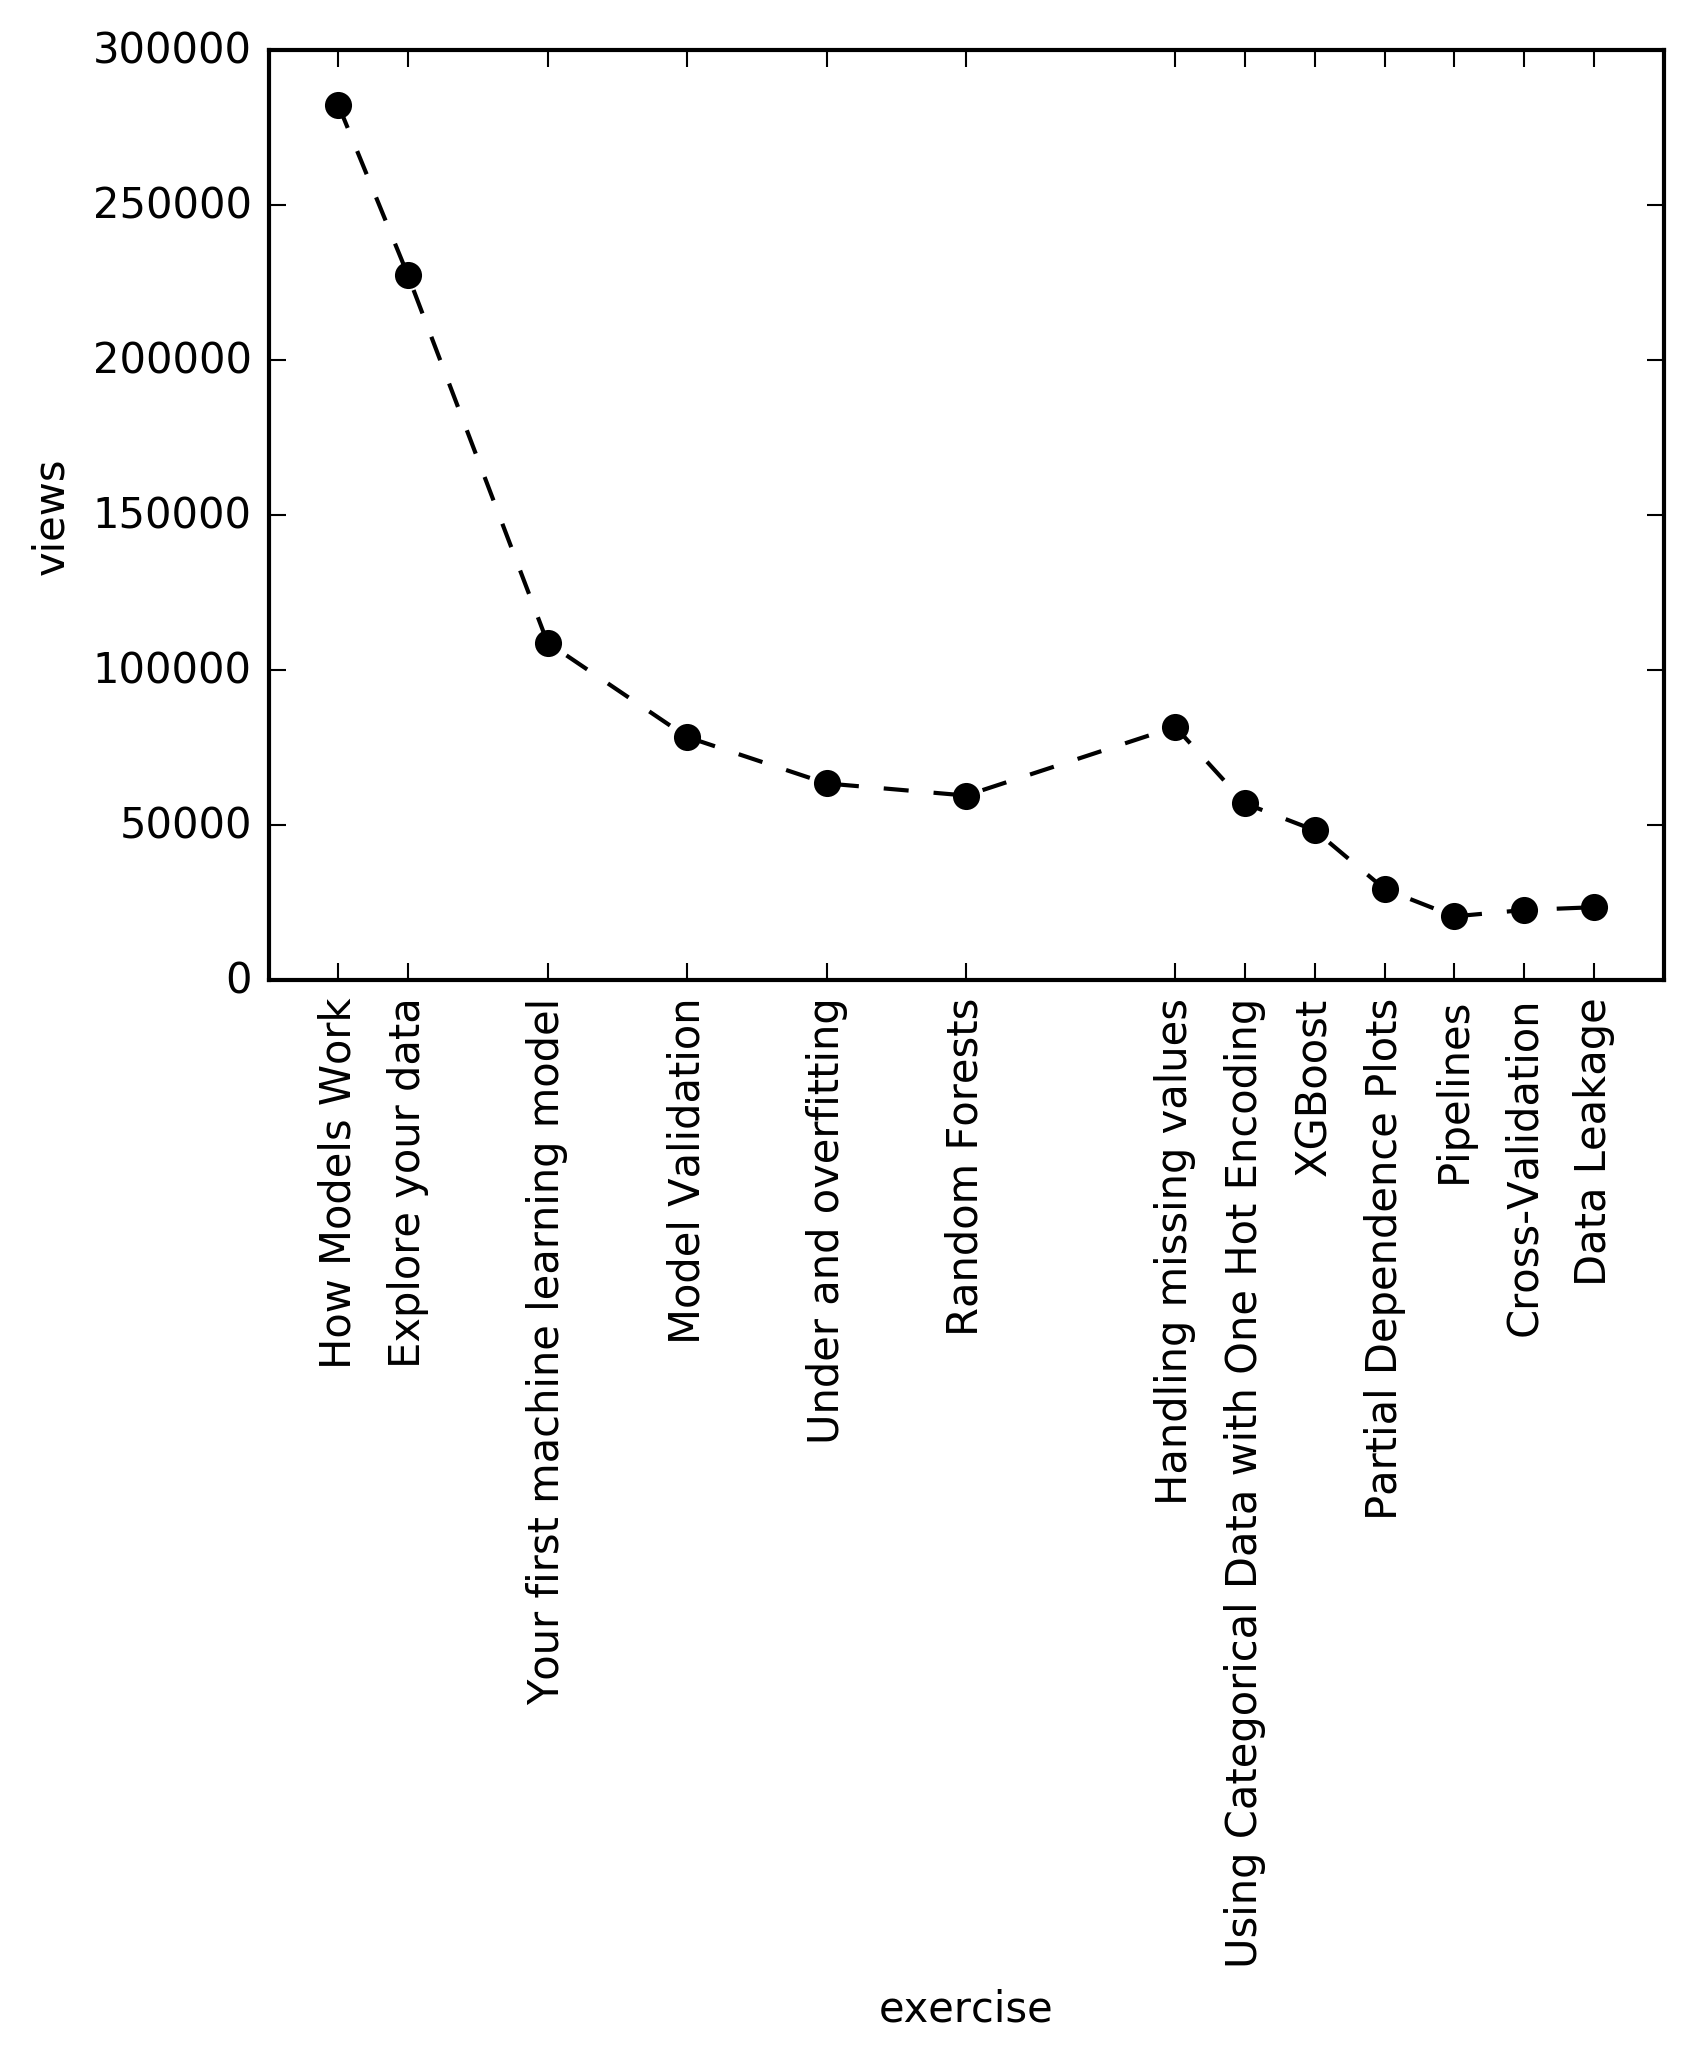
There is a slight bump of at the chapter “handling missing values”, which may be due to the fact, that many people wanna handle missing values, or because that is the first chapter of the Level 2 part, and many people just jumped there after couple of Level 1 chapters. Also, the ticks are farther between some chapters, the reason is, because I did not include the “exercises” between the chapters (no views were easily available for those), however I kept the original index, since maybe some people lost enthusiasm during those parts…:) Also, trend in the number of forks could have been a better representation of the actual decay… Just in case the code behind the plot is below. Values of the views are recorded today (2018. september 14.).
data=[[1, 282405,  'How Models Work'],
[2, 227382,  'Explore your data'],
[4, 108933,  'Your first machine learning model'],
[6, 78478,  'Model Validation'],
[8, 63490,   'Under and overfitting'],
[10, 59584,  'Random Forests'],
[13, 81739,  'Handling missing values'],
[14, 57043,  'Using Categorical Data with One Hot Encoding'],
[15, 48362,  'XGBoost'],
[16, 29441,  'Partial Dependence Plots'],
[17, 20600,  'Pipelines'],
[18, 22662,  'Cross-Validation'],
[19, 23557,  'Data Leakage']]

data=pd.DataFrame(data,columns=['ex','views','exnames'])

ax =plt.subplot()
ax.plot(data.ex,data.views,'ko--')
ax.set_xlabel('exercise')
ax.set_ylabel('views')
ax.set_xticks(data.ex)
ax.set_xticklabels(data.exnames, rotation=90)
plt.savefig('learningdecay.png',dpi=300,bbox_inches='tight')